Track Anything

Daily, monthly, and YoY visit patterns — by place, business, chain, ZIP Code, or industry.

Demo data below illustrates how Mobilytics can visualize traffic patterns across locations, businesses, chains, ZIP Codes, and industry categories.

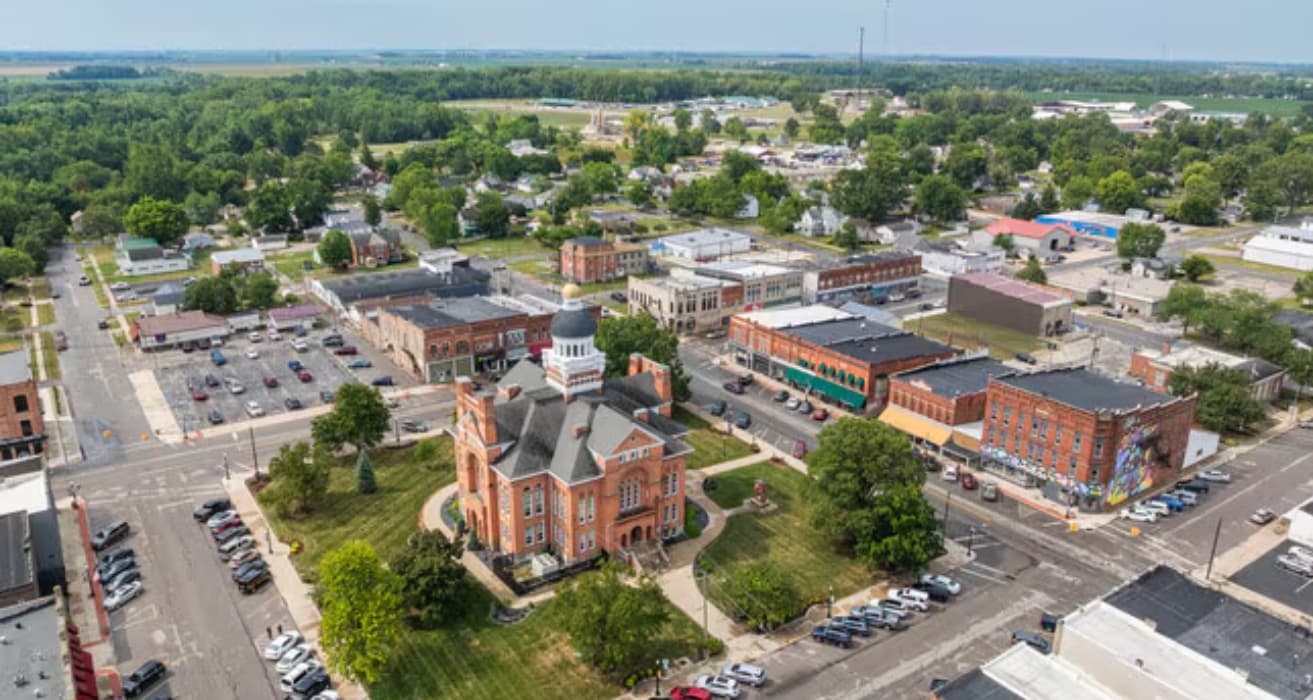
Track demand across specific places like parks and downtown corridors.
Location

Parks

Ballpark demo for a local park system: roughly 90K annual visits, averaging about 250/day with weekend lift.

Avg Daily

256

YoY Change

+7.0%

Daily Visits

7-Day View
MonTueWedThuFriSatSun

Monthly Visits YoY

12-Month View
Jan
Feb
Mar
Apr
May
Jun
Jul
Aug
Sep
Oct
Nov
Dec
Current YearPrior Year

Location

Downtown

Ballpark demo for a downtown district: roughly 1.1M annual visits, averaging about 3K/day with weekday commuter concentration.

Avg Daily

3,257

YoY Change

+5.5%

Daily Visits

7-Day View
MonTueWedThuFriSatSun

Monthly Visits YoY

12-Month View
Jan
Feb
Mar
Apr
May
Jun
Jul
Aug
Sep
Oct
Nov
Dec
Current YearPrior Year

Mobilytics

What this stop tells you

7:10 AM · Home

Home Base Identified

Example: The customer starts at Home, helping define the true residential origin and trade area.

1/9

1

Follow the path

Home to Publix, step by step.

2

Reveal behavior

See routines, errands, and cross-visits.

3

Make decisions

Improve targeting, trade areas, and site strategy.

Current Signal

Home Base

Current Stop

7:10 AM · Home

Journey Step

01/09

Impact Photo
Annual Visits

Total number of visits to your business over the past year, providing a comprehensive view of customer engagement and trends.

Impact Photo
Daily Visits

Number of visits per day, offering insights into daily traffic patterns and peak periods.

Impact Photo
Cross Visits

Data on customers who visit multiple locations, helping identify overlap and movement between sites.

Impact Photo
Customer Journey

Analysis of the customer experience from first contact to repeat visits, revealing key touchpoints and engagement patterns.

Impact Photo
Overlaps

Insights into areas where customer visits intersect between different locations, highlighting potential market cannibalization.

Impact Photo
Store Rankings

Performance metrics ranking your stores based on visit frequency and other key indicators, assisting in identifying top performers and areas for improvement.

FAQs

Does MapZot.AI provide cross-visit patterns?
down-arrow
Yes, MapZot.AI can track cross-visit patterns, revealing where visitors to your locations went before and after visiting your business. This insight helps businesses understand customer behavior, allowing for more informed decisions on site selection, marketing, and customer engagement.

Can MapZot.AI tell where visitors to a business come from or live?
down-arrow
Yes, MapZot.AI provides detailed information on where visitors to a business come from or live, offering critical insights into customer demographics and behavior. This data helps businesses target their customer base more effectively and optimize marketing efforts based on geographic patterns.

Does MapZot.AI provide cannibalization and impact studies?
down-arrow
Yes, MapZot.AI allows users to run cannibalization and impact studies on their existing business locations, as well as assess the impact on the broader market and competitors. This feature helps businesses understand how opening a new location might affect their current sites and the competitive landscape, enabling better strategic planning.

Can MapZot.AI show visits by hour, day, and week
down-arrow
Yes. MapZot.AI provides time-based visit data to analyze demand patterns and peak periods.

Ready to Grow Your Business with MapZot.AI?

Unlock the Power of Location Analytics with MapZot.AI’s industry-leading technology today.

Schedule Call